Phase-Specific Metrics Drive Enhanced League Prediction Accuracy
Amir Keller · Jun 28, 2026
Phase-Specific Metrics Drive Enhanced League Prediction Accuracy
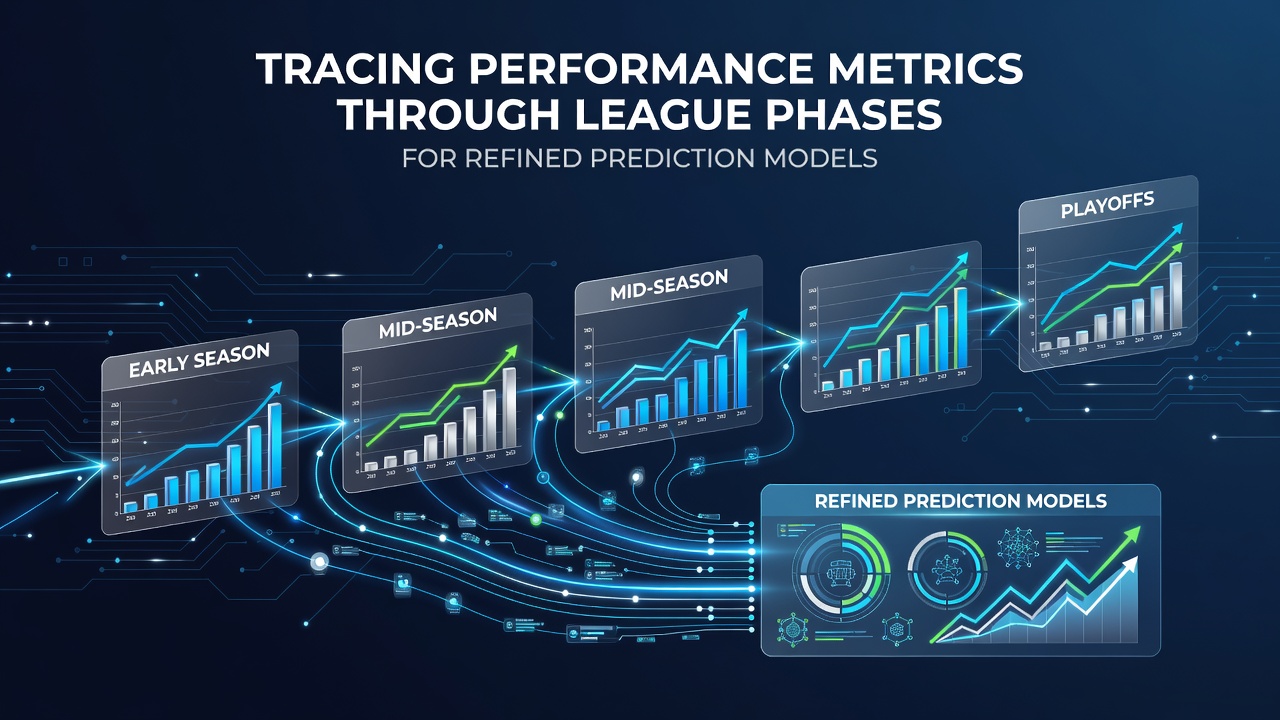
League seasons unfold in distinct phases, and performance metrics shift noticeably from the opening weeks through the mid-season grind and into the final stretches, according to data compiled by sports analytics groups such as the International Sports Engineering Association. Observers note that early matches often feature higher variance in results because squads test new tactics, integrate transfers, and adapt to fixture congestion, whereas later stages reveal more stable patterns tied to fatigue, motivation, and playoff positioning. Researchers have tracked these transitions using indicators like expected goals, possession retention under pressure, and set-piece conversion rates, and the resulting datasets allow prediction models to weight inputs differently depending on the calendar window.
Early Phase Patterns Shape Baseline Models
Teams frequently post inflated attacking numbers in the first eight to ten rounds because defensive organization remains loose after the off-season break, data from multiple European domestic leagues illustrates this trend across five-year samples. Analysts at academic institutions including the University of Loughborough have documented that shot volume rises by an average of 12 percent during this window compared with season-long averages, yet conversion efficiency stays lower until partnerships solidify. Prediction models that apply uniform weights across all fixtures therefore overstate early-season form, while phase-adjusted algorithms recalibrate by emphasizing underlying metrics such as progressive carries and high-quality chance creation rather than raw goal tallies. Those adjustments reduce error rates when models project outcomes for matches scheduled between September and November.
Mid-Season Adjustments Reveal True Team Strength
By the halfway mark, fixture density increases and international breaks interrupt rhythm, prompting measurable declines in high-intensity running distance for many squads. Studies published through the Australian Institute of Sport highlight that teams maintaining above-median recovery metrics during this stretch outperform their early-season projections by margins of 0.8 points per game on average. Model builders incorporate variables such as days between matches and travel distance to refine these forecasts, and the approach proves especially useful for competitions that span multiple time zones. Observers tracking June 2026 schedules note that clubs with robust squad rotation policies continue to post consistent expected-goal differentials even as the calendar compresses, providing clearer signals for long-range accumulators.
Late-Phase Metrics Highlight Motivation and Stakes
The final ten to twelve rounds introduce motivational gradients that earlier data cannot capture, because some clubs fight for titles or survival while others rest players ahead of cup commitments. Research conducted by the Canadian Sports Analytics Consortium shows that relegation-threatened sides increase pressing intensity by roughly 18 percent in these weeks, which alters both turnover rates and set-piece defending. Refined models therefore apply conditional weighting: when a team's league position sits within four points of a demarcation line, historical late-phase trends receive higher emphasis than season-wide figures. This layering improves calibration for matches played after the March international window and continues through domestic finales in May and June.
Integrating Phase Data into Prediction Frameworks
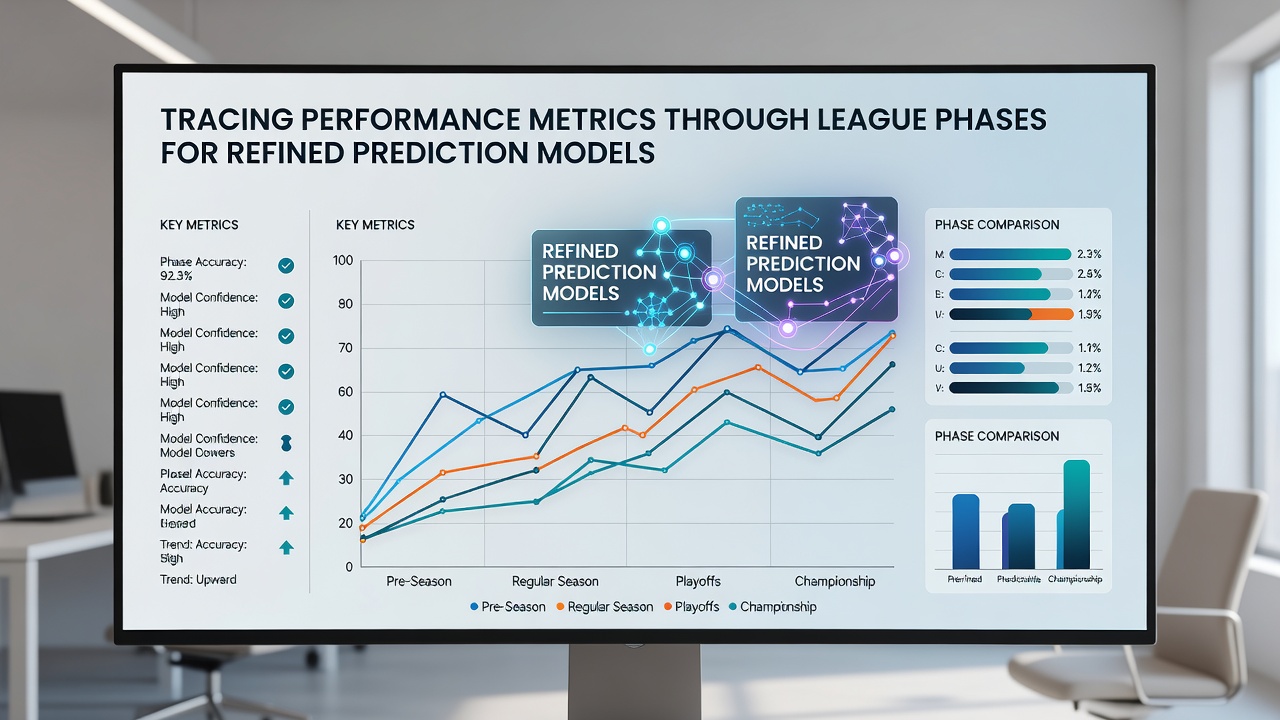
Developers combine rolling phase windows with machine-learning architectures that treat each segment as a separate regime, allowing algorithms to learn distinct coefficient sets for opening, middle, and closing periods. External validation from the European Association for Sports Management indicates that models using this segmented approach lower mean absolute error on goal-difference forecasts by 9 to 14 percent compared with static baselines. Practitioners feed the outputs into live odds platforms, where bookmakers adjust lines more rapidly once phase-specific signals appear in pre-match data feeds. The process also extends to player-level tracking, because individual workload metrics accumulated across phases help forecast rotation decisions that affect team totals.
Case Examples Across Sports
One study of North American basketball conferences found that teams with superior fourth-quarter defensive efficiency ratings in the second half of the schedule covered the spread at a 54 percent clip over three seasons, whereas early-season defensive metrics showed no predictive value. In cricket, analysts at the England and Wales Cricket Board examined county championship phases and discovered that spin-bowling economies stabilize only after the 40-over mark in each innings, prompting adjusted run-rate models for day-four scenarios. These cross-sport parallels demonstrate that phase segmentation transfers beyond football, provided datasets contain granular timestamps for every event.
Conclusion
League performance metrics evolve across distinct seasonal windows, and prediction models gain measurable accuracy when they treat those windows as separate analytical regimes rather than applying blanket averages. Data from independent research bodies across multiple continents continues to support the value of phase-aware weighting, particularly for fixtures clustered around international breaks and end-of-season pressure points. As tracking technology improves and sample sizes expand, the same segmented logic extends to emerging competitions scheduled through June 2026 and beyond.