Fatigue Patterns in Back-to-Back Fixtures: Refining Multi-Sport Parlay Approaches
Anna Hughes · Jun 7, 2026
Fatigue Patterns in Back-to-Back Fixtures: Refining Multi-Sport Parlay Approaches
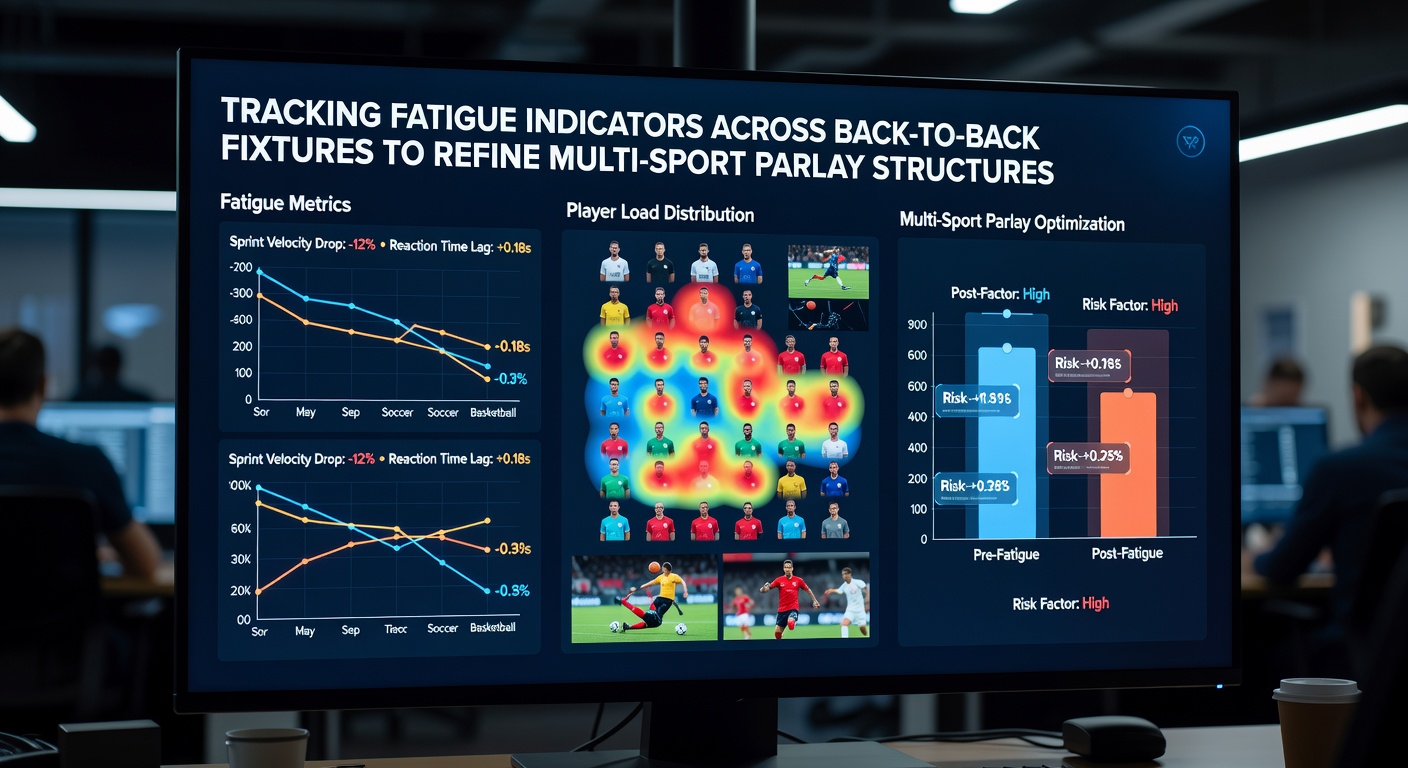
Back-to-back fixtures create measurable drops in player output that data analysts track across multiple sports, and these patterns feed directly into refined parlay structures that combine outcomes from different leagues and events. Researchers have documented consistent declines in metrics such as sprint distance covered, shooting accuracy, and error rates when athletes play with less than 48 hours of recovery, while longer rest periods show partial restoration of baseline performance levels.
Studies compiled by the Australian Institute of Sport reveal that elite athletes in team sports experience an average 12 percent reduction in high-intensity efforts during the second game of consecutive fixtures, and similar patterns appear in individual sports where travel and scheduling overlap. Observers note that these fatigue indicators become especially relevant when bettors construct parlays spanning football, basketball, and tennis because a single player's reduced capacity can influence several correlated selections at once.
Key Fatigue Indicators Across Sports
Performance databases show that basketball players logging back-to-back games record fewer points per minute and commit more turnovers, whereas soccer midfielders cover less ground and complete fewer successful passes in the second match. Tennis players exhibit extended rally durations followed by drops in first-serve percentages when matches occur on consecutive days, and these shifts compound when tournaments run alongside other major events. Analysts combine heart-rate variability readings, sleep duration logs, and workload ratios to quantify recovery status before fixtures begin.
June 2026 schedules place several leagues in compressed windows, with basketball playoffs overlapping early tennis grass-court events and international football qualifiers, creating opportunities to map fatigue across disciplines. Data sets from multiple seasons indicate that teams playing three games in five days post an 18 percent increase in defensive lapses compared with standard rest cycles, and bettors who integrate these statistics adjust parlay legs to favor under totals or opponent advantages.
Integrating Metrics into Parlay Construction
Multi-sport parlay builders now cross-reference recovery timelines from one sport against fixture lists in another, since fatigue in a basketball rotation can correlate with reduced output in a later soccer selection if the same market or region faces overlapping demands. Models weight variables such as travel distance, previous workload, and age-related recovery rates to assign adjusted probabilities rather than relying on season-long averages alone.
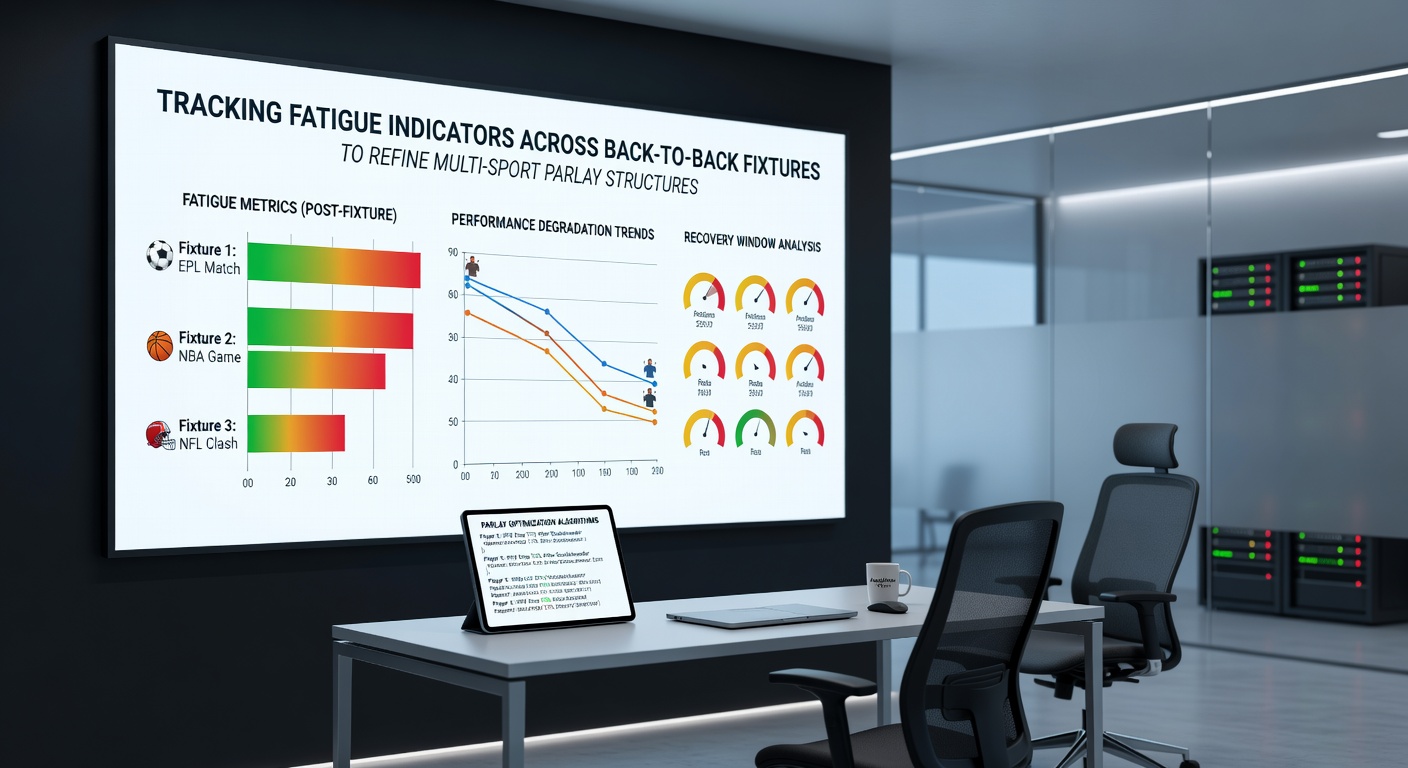
One case tracked by performance researchers involved a European football squad that played midweek and then traveled for a weekend match, resulting in a measurable decline in expected goals that aligned with similar patterns in an NBA back-to-back set occurring the same weekend. Bettors who layered these observations into parlays shifted selections toward lower-scoring outcomes in both sports, and historical records show improved alignment between predicted and actual results when such adjustments were applied consistently.
Data Sources and Modeling Techniques
Academic papers published in the Journal of Sports Sciences outline regression models that incorporate cumulative workload scores and acute recovery ratios to forecast performance variance, and these frameworks extend to parlay applications by treating multiple events as an interconnected system rather than isolated bets. Industry reports from the NCAA emphasize the role of load management in collegiate schedules, where back-to-back conference games produce documented drops in field-goal percentages that mirror trends observed in professional leagues.
Software platforms aggregate public box-score data with proprietary tracking information to generate fatigue scores that update daily, allowing parlay structures to adapt as new fixtures are confirmed. When schedules tighten in June 2026, these tools highlight clusters of consecutive games across tennis, basketball, and football, prompting bettors to reduce stake sizes on selections involving heavily fatigued participants or to pivot toward correlated outcomes such as higher foul totals in basketball alongside increased card counts in football.
Practical Adjustments and Ongoing Tracking
Practitioners review post-match GPS and accelerometer data to validate model inputs, then refine weighting factors for variables including altitude changes and time-zone shifts that further influence recovery. Those who maintain updated databases find that fatigue effects compound over longer tournament stretches, particularly when athletes compete in multiple sports or when youth-to-senior transitions create mismatched rest expectations.
Continuous monitoring allows structures to evolve rather than remain static, and analysts update parlay probabilities after each round of fixtures to reflect emerging patterns in workload accumulation. The approach treats fatigue as a dynamic variable that links outcomes across disciplines instead of an isolated factor within a single sport.
Conclusion
Tracking fatigue indicators supplies a measurable layer that connects consecutive fixtures across sports and supports more precise multi-sport parlay construction. Performance records, recovery metrics, and scheduling overlaps combine to produce adjusted probability estimates that reflect real-world conditions rather than static historical averages, and ongoing data collection refines these models as new seasons progress.