Distance-Specific Jockey Stats: Guiding Selective Wagers in Horse Racing
Morgan Brooks · Aug 6, 2026
Distance-Specific Jockey Stats: Guiding Selective Wagers in Horse Racing
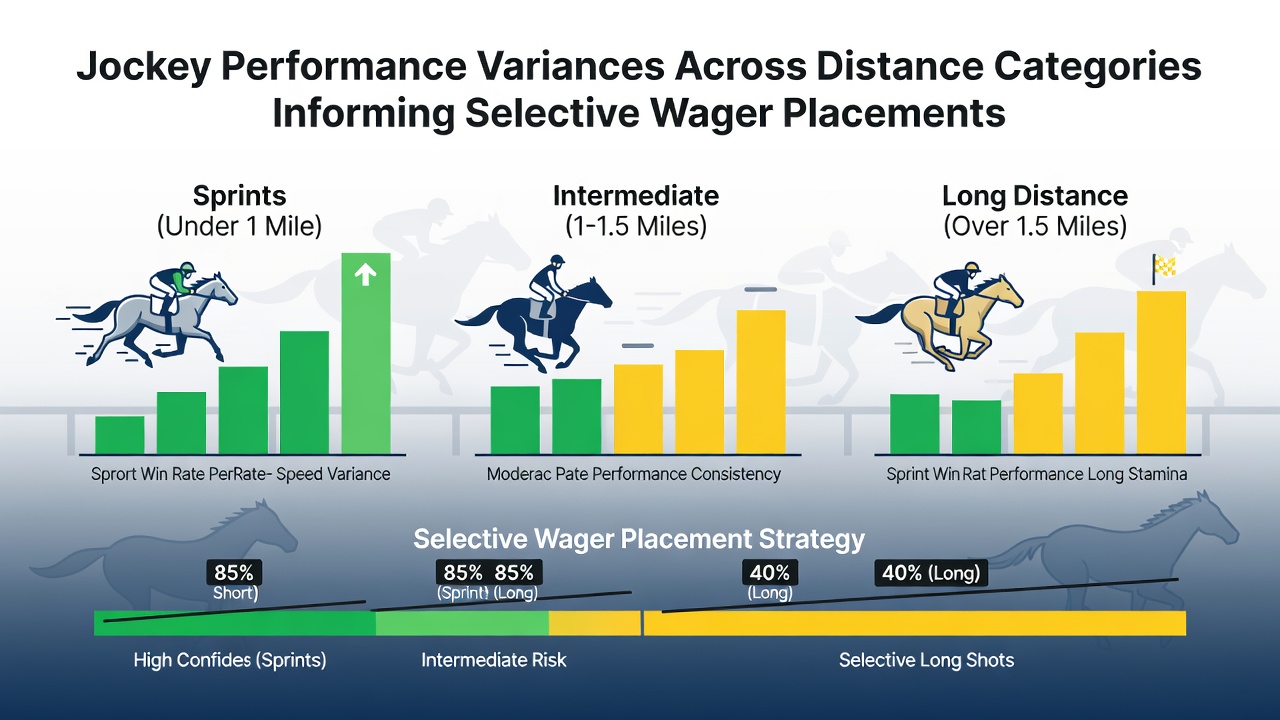
Distance categories in horse racing create clear performance patterns among jockeys, and data from multiple racing jurisdictions shows how these variances help refine wager selections. Sprints under 1400 meters favor riders who excel at quick breaks and tactical positioning, whereas races beyond 2400 meters reward those who manage pace and conserve energy for the final stages. Observers note that records compiled through 2026 continue to demonstrate these distinctions, with August 2026 updates from international racing bodies providing fresh seasonal benchmarks.
Defining Distance Categories and Their Demands
Racing analysts divide events into sprints, middle distances, and staying races, each imposing different physical and strategic requirements on both horse and rider. Sprints test explosive acceleration and gate speed, while staying races emphasize stamina management and timing of moves. Middle-distance contests blend elements of both, often producing the most variable outcomes when jockeys switch between categories. Those who've studied performance databases find that jockeys rarely maintain identical success rates across all three, and the gaps become statistically significant once sample sizes exceed several hundred rides per category.
Performance Metrics Across Categories
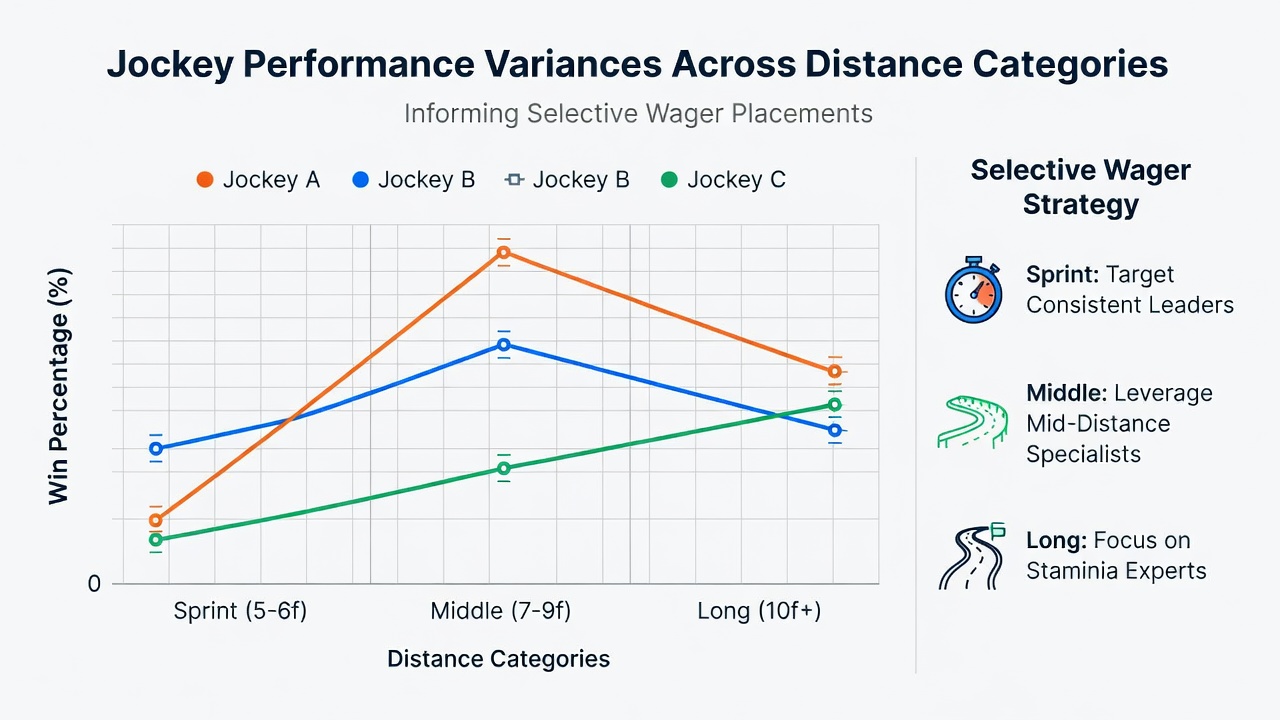
Strike rates, average finishing positions, and win-to-place conversion percentages reveal consistent patterns when segmented by distance. In sprint events, certain riders post strike rates 4 to 7 percentage points above their overall career average, according to aggregated figures from the Hong Kong Jockey Club. The same individuals often see those numbers drop when asked to ride in staying races, where patience and positioning replace early speed. Data indicates that middle-distance specialists frequently achieve higher place percentages because their style suits races with multiple tactical options, yet their outright win rates remain lower than pure sprinters in short contests.
Case Examples from Recent Seasons
One rider who recorded a 28 percent strike rate in sprints during the 2025-2026 season saw that figure fall to 11 percent when competing over 2400 meters or farther. Another jockey known for staying-race expertise maintained a 19 percent win rate beyond 2000 meters while posting only 9 percent in sprints. These differences appear repeatedly across seasonal reports and inform selective approaches that focus on matching rider strengths to race conditions rather than following overall reputation. What's interesting is how quickly these patterns emerge once distance filters are applied to large datasets.
Applying Metrics to Wager Placement
Selective wager strategies use these segmented statistics to narrow selections and adjust stakes. Bettors who cross-reference distance-specific records with current race conditions can identify mismatches where a sprint-oriented rider faces a staying test, or where a staying specialist drops back to a shorter trip. Research indicates that such mismatches produce lower strike rates for the rider in question, creating opportunities to oppose that runner or to support alternatives whose profiles align better with the distance. Industry organizations such as Racing Australia publish distance-filtered leaderboards that make this analysis accessible without requiring proprietary data.
Additional layers come from track configuration and going conditions, which interact with distance. Tight tracks amplify sprint advantages for certain riders, while undulating courses favor those experienced at conserving energy over longer trips. Figures reveal that combining distance metrics with these variables sharpens the edge, particularly in races where the field includes both specialists and versatile riders.
Broader Data Sources and Seasonal Updates
University-led studies, including work published in the Equine Veterinary Journal, have examined how rider decision-making varies with distance and fatigue accumulation. These findings align with operational data from racing authorities and support the practice of filtering jockey records before finalizing selections. August 2026 releases from several jurisdictions added several thousand new rides to the sample, confirming that existing patterns have held through the current season.
Conclusion
Distance-specific jockey performance data provides measurable inputs for wager decisions when applied consistently across categories. By focusing on verified strike rates, place percentages, and contextual factors rather than overall reputation, participants can refine their approach to match rider profiles with race requirements. Continued updates from racing organizations and academic sources ensure these metrics remain current for ongoing analysis.